A picture is worth a thousand words – especially when you’re trying to find relationships between the interconnections in your network and understand your network's data. Network topology is a concept used to define and describe the interconnections between devices or elements in an IT infrastructure network. You can view your network topography using a network topology map on network topology mapping software or network topology mapper tool.
OpManager's automatic network topology mapper has features that help you perform network visualization at ease, such as:
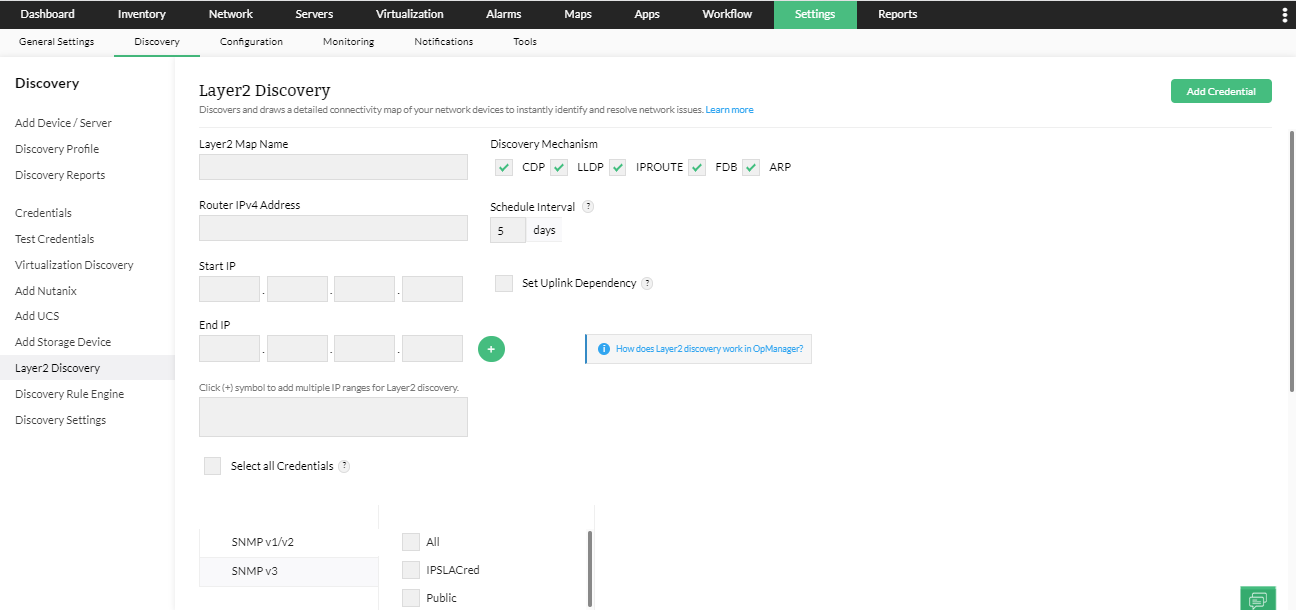
Network mapping software OpManager's Layer2 Maps provide network mapping features that help understand the physical topology organization of your Layer 2 networks by providing a real-time perspective of their interconnections.
OpManager, the network topology mapper, allows you to discover Layer 2 devices that are connected to your network and draws a logical, visual representation of it with nodes, interconnected layers, and port-to-port connectivity in addition to the interfaces.
Layer 2 Discovery helps network administrators visualize their complete network infrastructure with a live network map. It automatically discovers, maps, and reports on the complete set of devices such as servers, desktops, virtual machines, firewalls, and others present in your infrastructure. The supported protocols for network device discovery in OpManager are CDP, LLDP, IPROUTE, FDB, ARP.
Network topology mapper software, OpManager, also maps the network topology of your virtual infrastructure including VMware, Hyper-V, Xen, and Nutanix devices - This helps with network topology visualization. OpManager's networking diagram tool allows network administrators to selectively view connections like host to VM, host to network, host to datastore, VM to network, and VM to datastore.
OpManager provides four different network visualization options to help you better visualize the network architecture as below.
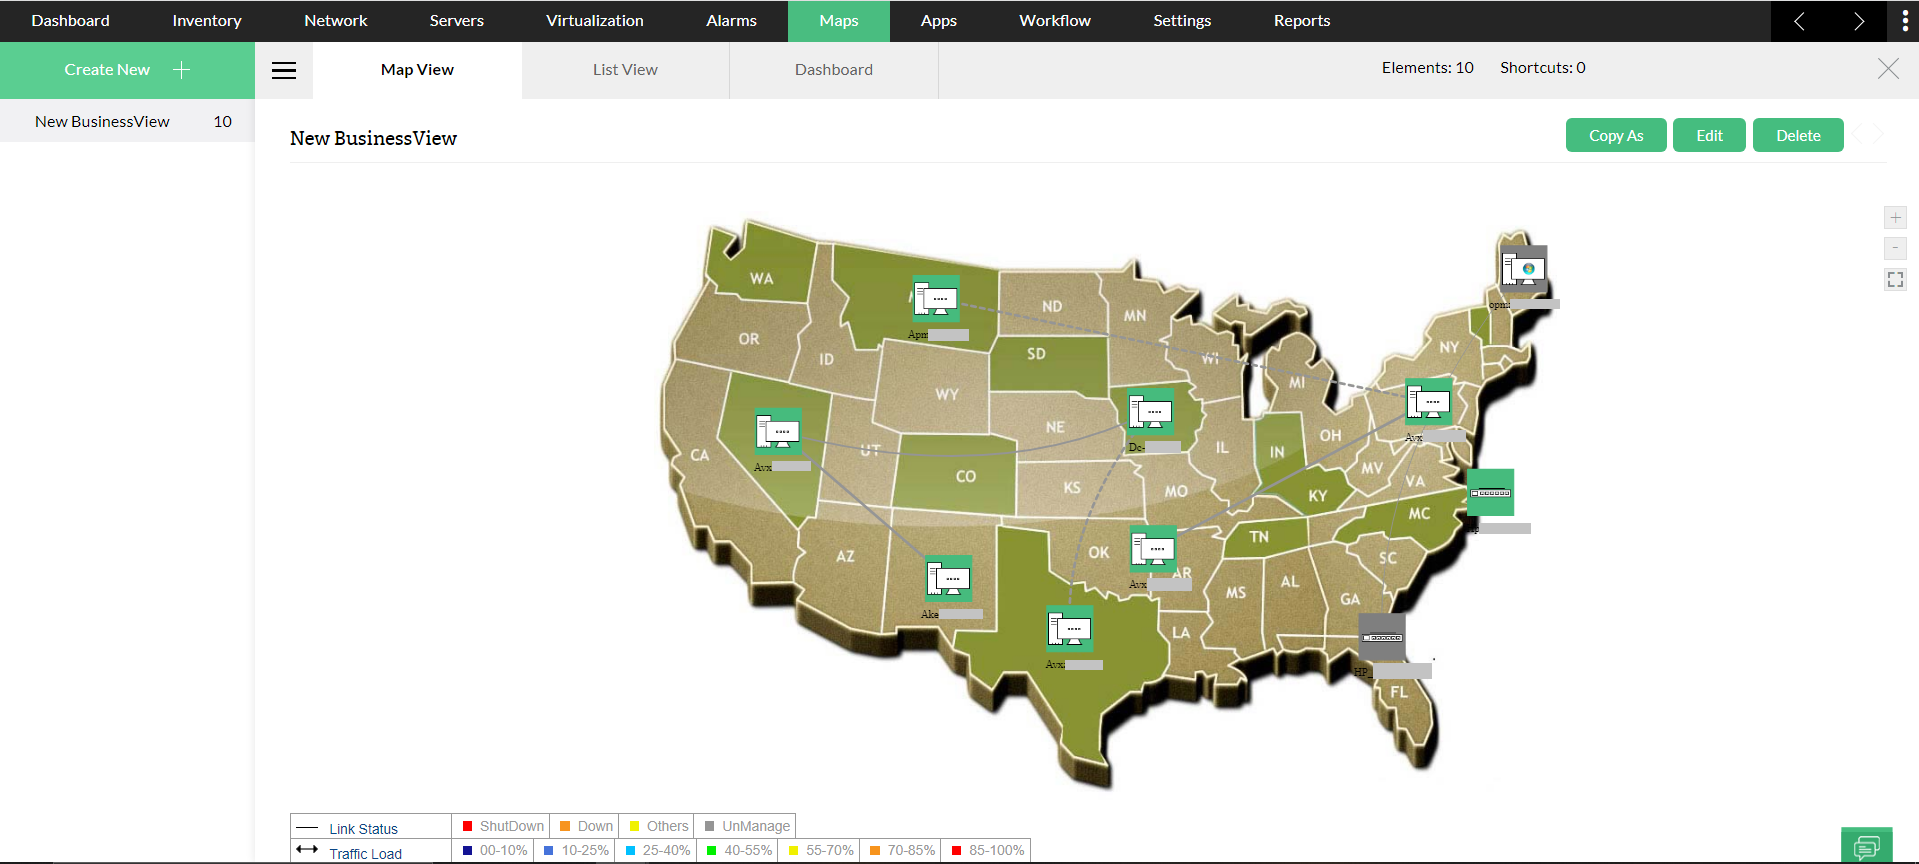
Business Views in OpManager provide a graphical representation of devices according to the business service, requirement, or operation they cater to. Layer 2 maps are meant to map network-level dependencies.
In Business View, IT admins can create network-level dependency mapping or business-level mapping. Adding links between devices in Business Views helps represent network diagrams on the map. These links can be configured based on user or organization requirements. IT admins can also export Layer 2 maps as Business Views using the 'Save as BV' option in the OpManager UI. With OpManager's network mapping solution, you can add a map to represent geographical locations, for example, countries or cities where data centers are located.
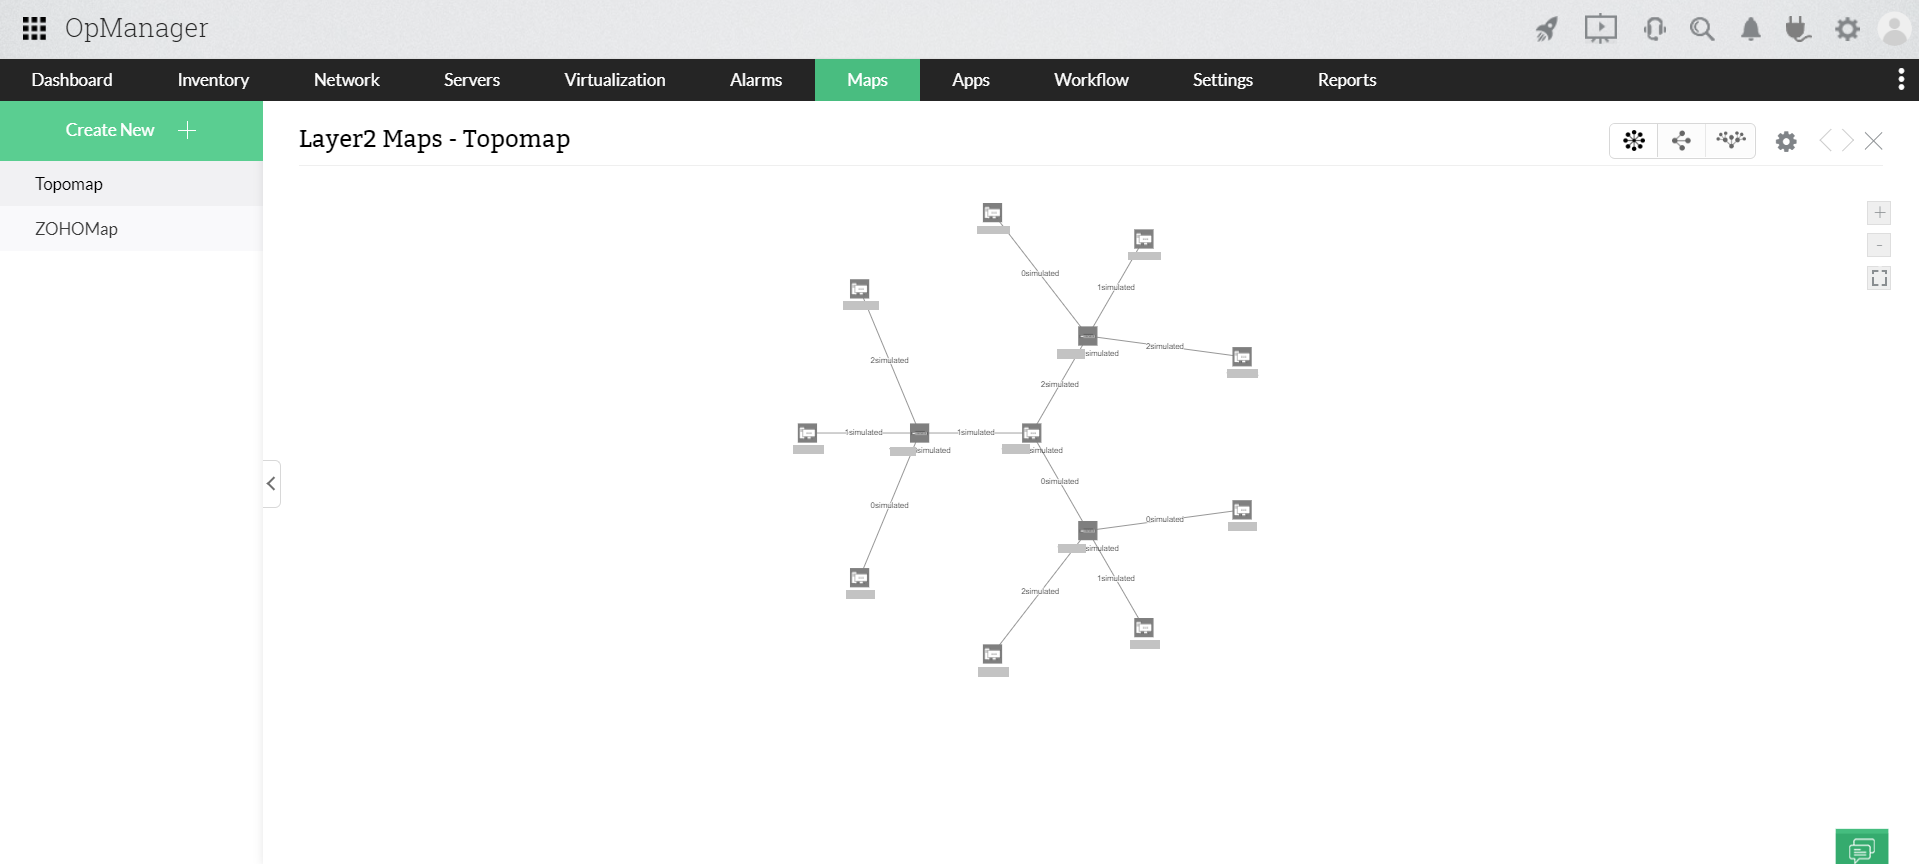
The IT network is dynamic and to get real-time views on device connections, layer2 maps is all you need. With the Layer2 mapper, you can get the network topology maps automaticallly created as soon as the devices are discovered. You can also schedule this process to automatically update addition or removal of devices in the network. This Layer2 map helps visualize the network infrastructure in real-time. With the option to choose seed device, you can prevent false alerts due to device-dependencies.
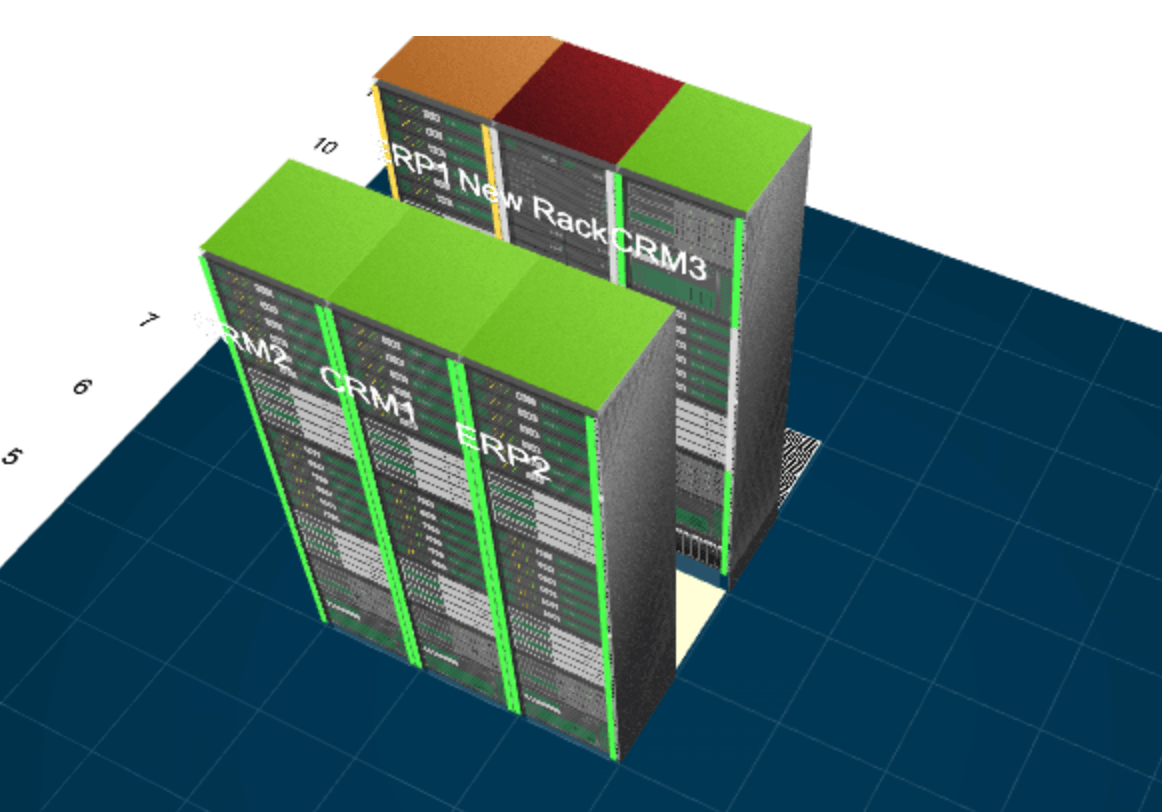
OpManager's 3D Floor views help you visualize the server and switches on each floor of your data center or server rooms in a single pane of glass. This makes it easier to locate servers or switches, view their status and identify faulty servers or switches with the help of color codes.
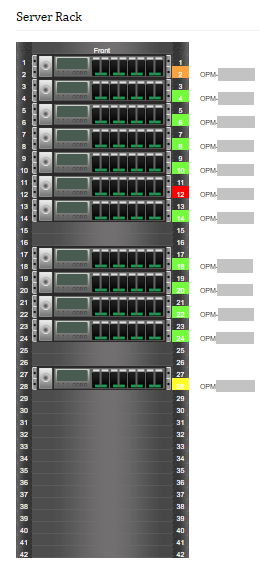
3D Rack views provide you with the topological representation of racks in your datacenters in their exact physical arrangement. This virtual understanding of network architecture helps you organize and manage datacenter effectively. When OpManager identifies a faulty device in the rack, you can click onto the device to view the snapshot page from where you can initiate fault diagnosis and network troubleshooting.
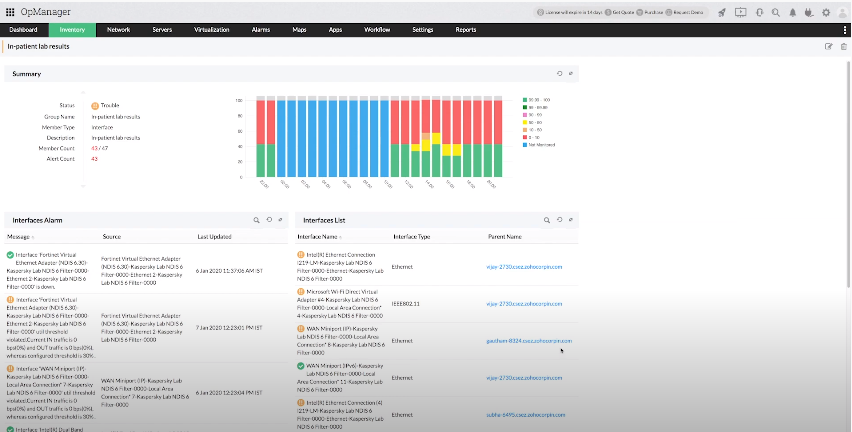
Network Topology Mapper OpManager can group and subgroup network devices or interfaces by department name, floor number, location, interface type, criticality, or any business-operation-defined group. This helps simplify network monitoring and applying configuration changes for multiple devices at once.
With this approach, IT admins can identify problematic devices and interfaces in each branch, group, or subgroup. This helps in understanding the usage trends of resources in each group or device, thus aiding in forecasting and capacity planning of the IT infrastructure. It eases inventory management and device discovery along with grouping and applying bulk configurations.
With dashboards, you can add multiple topological views as widgets and have the consolidated view of all of them in a single window, enabling centralized network management. This level of visualization helps with the holistic understanding of network architecture and identifying faulty devices on the go with color coded alarms. You can be up-todate with the status of the devices in business views or Layer2 maps with a single click refreshment. You can also have the graphical representation of data available for your better network understanding.
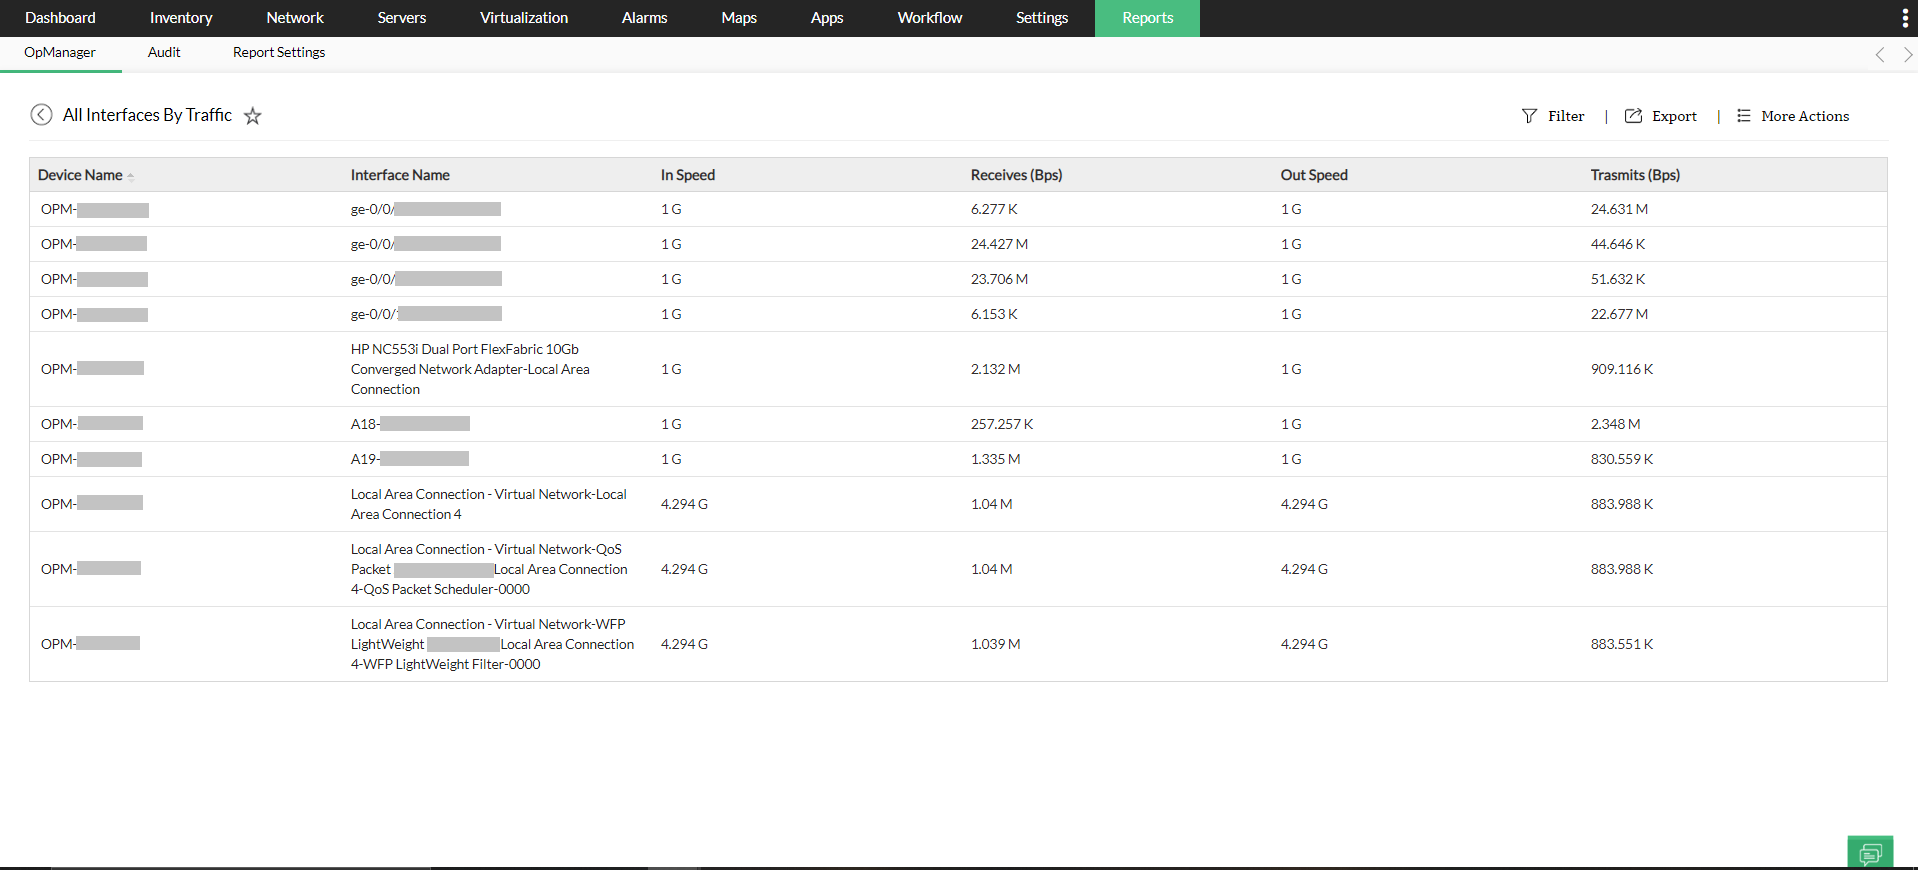
Detailed reports can be viewed and scheduled in OpManager to give a clear idea of network devices, interfaces, group performance, availability, activities, and more. Reports can be generated for discovered devices or devices in Business Views, too. Reports can be scheduled on a daily, weekly, or monthly basis. Also, generated reports can be delivered in PDF or XLS formats, as needed by the IT admin. Custom reports and Top N reports can also be generated.
With OpManager 's mobile application, monitoring your network devices need not to be restricted to desk. Instead, you can monitor and visualize network infrastructure in real-time from wherever you are.
The OpManager's mobile application helps you gain more visibility into device groups: their performance, configurations and more; get notified of status of business critical applications, be aware of changes in network devices in general without having to closely monitor them. You can also remotely troubleshoot network issues and stay on top of your network, on the go, with the mobile app.
Know more about network diagrams and the types of network diagramming views.